

 Tiếng Việt
You can tell whether your website is under a DDoS attack by looking for three signs. First, traffic and connection counts surge abnormally within a short time, with the sources concentrated or behaving identically. Second, the server’s CPU, memory, bandwidth or connections are exhausted, so the site slows down or won’t load at all. Third, users see large numbers of 502, 503 or 504 error codes, or connection timeouts. When all three signs appear together and even legitimate users cannot connect, a DDoS attack is very likely.
In a DDoS (Distributed Denial of Service) attack, the attacker controls a large number of infected devices, known as a botnet, and has them send huge volumes of traffic or requests to a target at the same time. This exhausts the website’s resources so legitimate users can no longer use the service. Attack traffic is often mixed in with normal traffic, so the earlier you identify it, the less damage a service outage will cause.
Below, we explain how each of the three signs shows up in practice, and how to tell an attack apart from a traffic peak driven by a marketing campaign, or from a server failure.
Sign 1: Abnormal traffic and connections
When a website comes under DDoS attack, the first sign is usually abnormal traffic and connections. The attacker has a large number of devices connect at the same time, so the site’s bandwidth, request count or connection count rises sharply within a short period. These changes show up directly in monitoring data, which makes this the easiest warning sign to spot.
However, a rise in traffic doesn’t necessarily mean an attack. Website traffic naturally fluctuates with business hours, holidays and marketing campaigns. For example, an e-commerce site may see a flood of visitors in a short time during an anniversary sale, Singles’ Day (11.11) or Mother’s Day promotion, or when the brand makes the news or a social post goes viral.
The key is whether the increase in traffic has an identifiable cause, and whether its sources and behavior look like real users. Here are the common ways attack traffic shows itself.
Sudden surge in bandwidth or requests
The most obvious anomaly is a large number of requests coming from the same IP, the same subnet, or a country that normally sends almost no visitors. For example, a website that mainly serves users in Taiwan suddenly receives a flood of overseas connections. But today’s DDoS attacks are mostly launched through botnets, so the sources may be spread across tens of thousands of IPs, and the request volume from any single IP may not look high. In that case you need to look at overall behavior. If these IPs send requests at almost exactly the same times with almost exactly the same content, they don’t look like real users.
Request behavior that doesn’t look human
Real visitors browse several pages and stay for a while, and their browsers also load static resources such as images and CSS. Attack traffic, by contrast, often hammers a single URL, such as the home page, search page or login page, with each request lasting less than a second and loading no other resources. In addition, if a large number of requests share an identical User-Agent (the browser identification string), or the User-Agent is obviously forged or malformed, that is a hallmark of automated attack tools.
Abnormally high connection counts
Some attacks don’t rely on large traffic volumes, but on tying up the server’s connection resources. Take a SYN Flood as an example: the attacker sends a huge number of connection requests but never completes the final step of establishing the connection, leaving the server with a large number of “half-open connections” (in the SYN_RECV state). These connections fill up the maximum number of connections the server can handle, so even if bandwidth isn’t yet saturated, new legitimate visitors cannot connect.
Large volumes of non-web traffic
Normal website traffic is mostly HTTP/HTTPS. If your monitoring shows large volumes of UDP, ICMP or other non-web packets, that is usually a sign of something wrong. These are network-layer attacks, aimed at filling the bandwidth directly so that no traffic can get through. UDP Floods have also become one of the most common attack types in recent years.
Note that application-layer (L7) HTTP Flood attacks mimic normal web requests. Each request looks perfectly normal, and total bandwidth isn’t necessarily especially high. So when assessing traffic, don’t look at bandwidth figures alone. Also watch requests per second, which URLs are being requested and where requests come from, so you don’t miss these stealthier attacks.
Sign 2: Server performance exhausted
The second sign of a DDoS attack is exhausted server performance. The core purpose of a DDoS attack is to consume resources. When a flood of requests arrives at once, the server’s CPU, memory, bandwidth and connections fill up quickly, and the site goes from slow to completely unreachable.
Unlike a simple software bug, these performance warnings tend to hit multiple servers and multiple services at the same time, with no clear internal cause: no new release has gone live and no settings have been changed. The five most common symptoms are as follows.
CPU and memory usage near 100% for long periods
Normally, server resource usage rises and falls with traffic and drops back after a peak. If no new code has been deployed and there are no scheduled jobs or data backups running, yet CPU and memory stay close to full load, a large number of requests are consuming resources. This is also a common symptom of L7 attacks, because every request requires the server to do processing work.
Website response times increase dramatically
The most direct effect of exhausted performance is a slower website. A page that used to open in 1 to 2 seconds suddenly takes more than ten seconds, stays stuck loading, or only shows half its content. For e-commerce sites, slow checkout and payment flows directly cost orders. For financial and government services, they disrupt people trying to get things done online.
Server connections hit their limit
Every web server has a limit on how many connections it can handle simultaneously. When an attacker opens large numbers of connections and holds them for a long time, legitimate visitors can’t get in line, and their screens show connection timeouts or error pages. In this situation, even if the server’s CPU still has headroom, the site still appears “down” from the outside.
Database connections exhausted
Pages such as search, member login and product lookup query the database every time, which costs far more processing than ordinary static pages. Attackers often deliberately target these pages, using relatively few requests to overload the database and exhaust its connections, dragging down the entire site. If host monitoring looks normal but database queries are timing out in large numbers, an attack could be the cause.
Internal systems are affected too
When attack traffic saturates a company’s outbound network bandwidth, it isn’t just the website that suffers. Internal systems used by employees, email, video conferencing and even the customer service phone system may all slow down or drop. If several services that normally have nothing to do with each other fail at the same time, suspect that the shared network gateway is under attack.
The key test is whether even legitimate users cannot connect. If only a few users report being unable to connect, the problem is more likely their local network, DNS or account permissions. If access fails across the board, for internal staff and external customers alike and on every kind of network, the first thing to suspect is that the website is under DDoS attack.
Sign 3: Specific error codes appear
The third sign of a DDoS attack is users starting to see specific error codes in large numbers. When server resources are exhausted and new requests can’t be processed, the browser displays an error page instead of the normal website content.
These error codes are HTTP status codes returned by the server or gateway, and they help pinpoint where the problem lies. The following are the error codes that appear most often during a DDoS attack.
| Error code | What it means | How it relates to a DDoS attack |
| 503 Service Unavailable | The server temporarily cannot handle the request | 503 is the code most commonly linked to DDoS attacks. It means server resources are full and no new requests can be accepted. |
| 504 Gateway Timeout | The gateway or proxy server received no response from the backend | A 504 means the backend server may have been slowed down by a flood of requests and timed out. |
| 502 Bad Gateway | The gateway received an invalid response from the backend | A 502 may mean the backend service crashed or restarted due to excessive load. |
| 429 Too Many Requests | The number of requests exceeded the limit | A 429 may mean rate limiting has been triggered because one source sent too many requests. |
| Connection timeout (ERR_CONNECTION_TIMED_OUT) | The browser could not reach the server within the time limit | A connection timeout means bandwidth is saturated or connections are exhausted, so packets can’t reach the server. |
These error codes are usually discovered in two places. One is the user side: customer service suddenly receives lots of “the website won’t open” calls, or users start reporting problems on social media. The other is the server side: from the access log you can tally the proportion of each status code. If the share of 5xx errors jumps from near zero within a short time, that is a clear warning sign.
However, error codes alone can’t confirm a DDoS attack with 100% certainty, because software bugs, server failures and failed system updates can also produce 502 and 503 errors. Error codes need to be read together with the traffic data from Sign 1. For example, a surge in error codes at the same moment as an abnormal spike in traffic is a strong signal of a DDoS attack.
How do you tell a DDoS attack apart from a normal traffic peak or a server failure?
A slow website isn’t necessarily under DDoS attack. A promotion or news coverage that brings in large numbers of real visitors, or a problem with the server hardware or the application itself, can produce similar symptoms. You can tell them apart by comparing the following aspects.
| Aspect | DDoS attack | Normal traffic peak | Server or application failure |
| Timing | No warning; often late at night, on holidays or during important events | Matches the timing of a marketing campaign or news coverage | Often occurs after a system update or configuration change |
| Traffic change | Surges within a short time, by several or even dozens of times | Rises gradually, by a traceable amount | Traffic normal or lower than usual |
| Traffic sources | Concentrated on specific IPs, subnets or countries, or highly uniform behavior | Widely distributed, matching the usual regional and device mix | Sources normal |
| Visitor behavior | Repeatedly hits the same URL, very short visits, not human-like | Browses multiple pages, stays a while, converts | Behavior normal, but pages throw errors |
| Scope of impact | Internal and external users broadly unable to connect; may spill over to other services | Site slows down, but most users can still use it | Specific features or specific servers fail |
In short, if traffic suddenly surges for no identifiable reason, and its sources and behavior don’t look human, treat it as a DDoS attack.
How to check for yourself whether your website is under DDoS attack
If you suspect your website is under DDoS attack, follow these steps to confirm quickly. You don’t need to shut down any servers during this process, and we don’t recommend doing so.
- Check the site’s status from outside. Open the website over mobile data or from a network in a different location, to rule out a problem with your company’s internal network only.
- Review monitoring data. Open the monitoring dashboard for your servers, CDN or cloud platform, and compare current bandwidth, request counts and CPU against the same time on a normal day to see whether they differ greatly.
- Analyze the access log. Tally the IPs, URLs and User-Agents with the most requests to see whether they are concentrated in a few sources or a few pages.
- Check connection states. On a Linux server, run netstat -an | grep SYN_RECV | wc -l. If the number of half-open connections is far higher than usual, you may be under a SYN Flood attack.
- Rule out other causes. Confirm there have been no recent code updates, configuration changes or marketing campaigns, and ask your hosting provider or ISP whether there is a regional network problem.
- Ask a security provider to help interpret the data. If the checks above all point to abnormal traffic, contact your ISP, hosting provider or DDoS protection provider immediately and have a professional team analyze the type of traffic.
If your website has no monitoring tools and no dedicated IT staff, you can go straight to step 6. The sooner a professional team analyzes the situation, the shorter the service outage will be.
In addition, according to the Cybersecurity Incident Response Action Guidelines issued by the Administration for Cyber Security under Taiwan’s Ministry of Digital Affairs, when a DDoS attack occurs you should not simply shut down or force-power-off the servers, nor wait passively for the traffic to subside. Instead, you should actively analyze traffic volume and type, seek support from your telecom provider or a traffic scrubbing center, and activate your business continuity plan.
What should you do first once a DDoS attack is confirmed?
Once you’ve confirmed that your website is under DDoS attack, the most important rule is: don’t shut down, and get outside help immediately. The Cybersecurity Incident Response Action Guidelines issued by the Ministry of Digital Affairs’ Administration for Cyber Security warn that a forced shutdown destroys log evidence, while waiting passively for the attack to end lets losses keep piling up.
We recommend handling it in this order:
- Preserve records. Save monitoring screenshots and access logs as the basis for later tracing analysis and incident reporting.
- Contact outside parties. Notify your ISP, hosting or colocation provider, or DDoS protection provider, and bring in a traffic scrubbing service.
- Activate your backup plan. Following your business continuity plan, use a fallback page or alternative channels to keep customers informed.
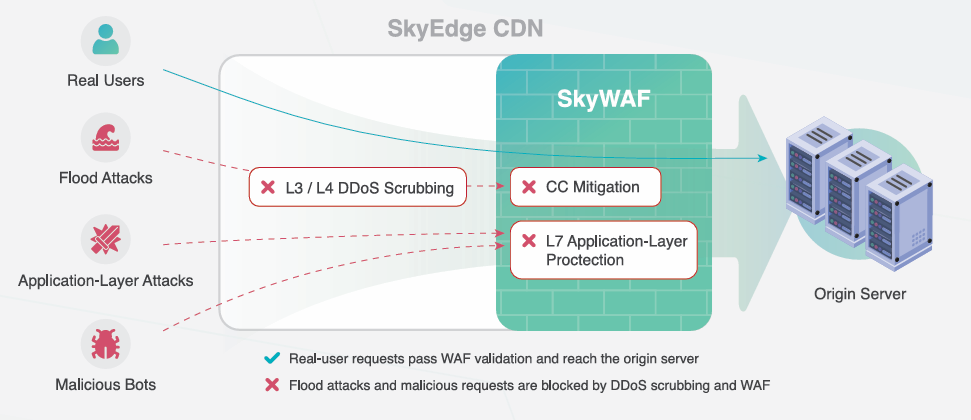
A DDoS attack can’t be handled by a company’s internal team alone. It requires an outside provider with traffic scrubbing capability. SkyCloud Computing operates 5 dedicated DDoS scrubbing centers, capable of defending against all attack types, including massive volumetric DDoS, Super CC attacks (3 billion connections), and botnets. SkyCloud Computing provides 24/7 DDoS defense, with a professional cybersecurity team that analyzes and scrubs attack traffic in real time.